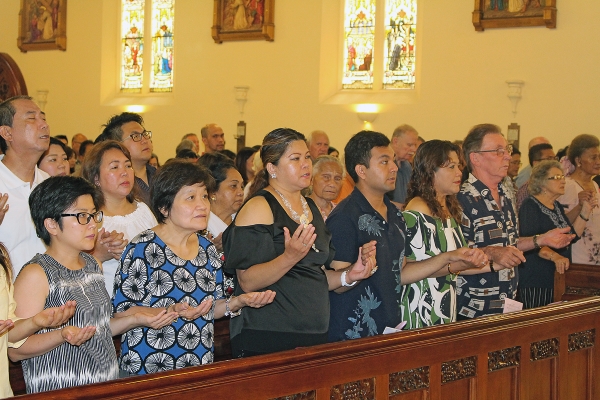
Catholics are still the largest “religious” group in New Zealand, according to 2018 census data, but the number of people identifying as Catholic has continued to drop.
In data released by Statistics New Zealand last month, the number of people identifying as Catholic in the 2018 census could be calculated as 469,935.
The figure for Catholic religious affiliation in the 2013 census was 492,324 and in 2006 it was 508,812.
In 2018, Catholics made up 10 percent of New Zealand’s usually resident population. In 2006, that figure was 12.35 per cent.
The number of people identifying as Anglican in the 2018 census showed an even sharper decline. The number dropped from 554,925 (2006) to 459,771 (2013) to 314,913 (2018). The number of people identifying as “Christian” in 2018 was 307,926, Baptist (35,967), Presbyterian (221,199), Methodist (68,526), and Born Again (35,967).
There were 121,644 people who identified in 2018 as Hindu, 55,804 as Muslim, 40,908 as Sikh and 5274 as Jewish.
There were also 1149 satanists, 7068 atheists, 6516 agnostics, and 20,408 who identified as “Jedi”.
Those who answered “No Religion” were 2,264,601, up from 1.635 million in 2013. In 2018, there were also 312,795 respondents who objected to answering the question.
The percentage of people identifying as Christian overall dropped from 47.65 per cent of the population in 2013 to 37.31 per cent in 2018.
New Zealand’s usually resident population on census night (March 6, 2018) was 4,699,755, up from 4,242,048 in 2013.
There were concerns about the coverage of the 2018 census. Statistics NZ explained in releasing the data that “we combined data from the census forms with administrative data to create the 2018 Census data set, which meets Stats
NZ’s quality criteria for population structure information”.
“We added real data about real people to the data set where we were confident they should be counted, but they hadn’t completed a census form. We also used data from the 2013 Census and administrative sources, and statistical imputation methods to fill in some missing characteristics of people.”
The religious affiliation data was derived from 2018 census responses (about 82 per cent), 2013 census data (about 8 per cent) and “imputation” (about 10 per cent).

Reader Interactions